Bar Graph
Category : 5th Class
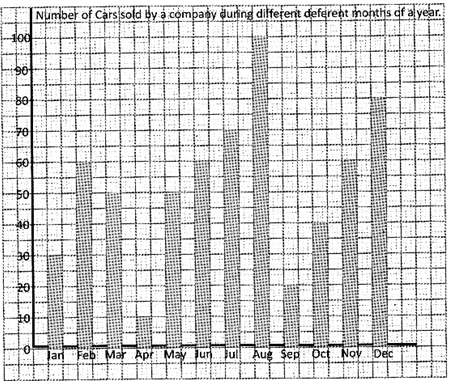
When the numerical information is represented on the graph using bars, it is known as bar graph. Let us understand it with the help of an example: In the following table number of cars sold by a company in different months of a year has been shown:
| Month | Number of cars |
| January | 30 |
| February | 60 |
| March | 50 |
| April | 10 |
| May | 50 |
| June | 60 |
| July | 70 |
| August | 100 |
| September | 20 |
| October | 40 |
| November | 60 |
| December | 80 |
Let us make a bar graph using above information:
Step 1: Draw one horizontal and one vertical line.
Step 2: Choose a convenient scale and mark the numbers on the vertical line at equal interval.
Step 3: Now make bars, keeping width of the bars and distance among them uniform. Length of the bars is equal to the respective numbers
![]()
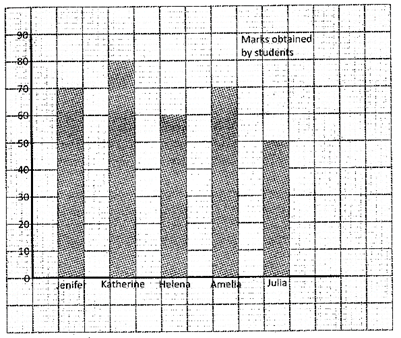
Read the given bar graph and answer the following questions:
(i) Name the student who got the highest mark
(ii) Find the marks obtained by Amelia
(iii) What scale has been chosen in the bar graph
Solution:
(i) Katherine got the highest mark
(ii) Amelia obtained 70 marks
(iii) 1 cm = 10 marks

![]()

In the following pictograph, number of video games sold by a shop has been shown
| Monday | |
| Tuesday | |
| Wednesday | |
| Thursday | |
| Friday | |
| Saturday | |
| One |
|
(The following questions are based on the above pictograph)
![]() Which one of the following days 49 video games were sold?
Which one of the following days 49 video games were sold?
(a) Monday
(b) Saturday
(c) Thursday
(d) Wednesday
(e) None of these
Answer: (b)
Explanation
In the pictograph 1 ![]() represents 7 video games And \[7\times 7=49\]
represents 7 video games And \[7\times 7=49\]
Thus it is Saturday when 49 video games were sold.
![]() How many more video games were sold on Thursday than that of Friday?
How many more video games were sold on Thursday than that of Friday?
(a) 7
(b) 14
(c) 21
(d) 28
(e) None of these
Answer: (c)
![]() Which one of the following day's minimum number of video games was sold?
Which one of the following day's minimum number of video games was sold?
(a) Wednesday
(b) Monday
(c) Saturday
(d) Thursday
(e) None of these
Answer: (a)
![]() How many video games were sold on Monday?
How many video games were sold on Monday?
(a) 7
(b) 14
(c) 21
(d) 28
(e) None of these
Answer: (d)
![]() How many video games were sold during first four days of the week?
How many video games were sold during first four days of the week?
(a) 120
(b) 140
(c) 160
(d)180
(e) None of these
Answer: (b)
![]() How many video games was sold on Friday?
How many video games was sold on Friday?
(a) 7
(b) 28
(c) 42
(d) 35
(e) None of these
Answer: (d)
![]() In the following bar graph temperature on different days of a week has been shown.
In the following bar graph temperature on different days of a week has been shown.
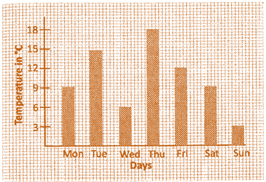
Read the above graph and answer the following questions: Which one of the following days had highest temperature?
(a) Monday
(b) Tuesday
(c) Wednesday
(d) Thursday
(e) None of these
Answer: (d)
![]() By how much temperature reduced on Friday in comparison of Thursday?
By how much temperature reduced on Friday in comparison of Thursday?
(a)\[{{3}^{o}}C\]
(b) \[{{6}^{o}}C\]
(c) \[{{9}^{o}}C\]
(d) \[{{12}^{o}}C\]
(e) None of these
Answer: (b)
![]() Which one of the following scale has been chosen in the bar graph?
Which one of the following scale has been chosen in the bar graph?
(a)\[1cm\text{ }={{3}^{o}}C\]
(b) \[1cm\text{ }={{6}^{o}}C\]
(c)\[1cm\text{ }={{9}^{o}}C\]
(d) \[1cm\text{ }={{12}^{o}}C\]
(e) None of these
Answer: (a)
![]() If the temperature on Monday was \[{{15}^{o}}C\] by what cm length of the bar of Monday would had been increased?
If the temperature on Monday was \[{{15}^{o}}C\] by what cm length of the bar of Monday would had been increased?
(a) 1cm
(b) 2cm
(c) 3cm
(d) 4cm
(e) None of these
Answer: (b)
![]() Which one of the following days was the coldest day of the week?
Which one of the following days was the coldest day of the week?
(a) Sunday
(b) Monday
(c) Thursday
(d) Tuesday
(e) None of these
Answer: (a)


You need to login to perform this action.
You will be redirected in
3 sec

