Quadrilateral is a figure which is bounded by four straight lines. A quadrilateral has four vertices, four sides, four angles and sum of angles is\[{{360}^{{}^\circ }}\].
TYPES OF QUADRILATERAL
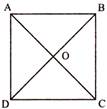
Square:-
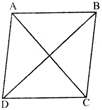
A quadrilateral which sides are equal and each angle is equal to \[{{90}^{{}^\circ }}\] is called square.
Diagonals of square are equal and cut each other at\[{{90}^{{}^\circ }}\].
i.e., \[AB=BC=CD=DA\].
\[\angle A=\angle B=\angle C=\angle D\]
and \[AC=CD\].
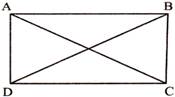
Rectangle
A quadrilateral whose all angles arc right angle and. each pair of opposite sides are equal is called Rectangle.
i.e., \[\angle A=\angle \mathbf{B}=\angle C=\angle D={{90}^{{}^\circ }}\], and \[AB=CD,AD=BC\] The diagonals of rectangle are equal and bisect each other at right angle. Each diagonal divides rectangle into congruent triangles.
i.e., \[AC=BD\] and \[\Delta ADC=\Delta ABC\], \[\Delta ABD=\Delta BCD\]
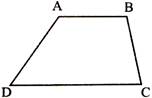
Trapezium: A, quadrilateral in which exactly one pair of parallel sides are equal is called a trapezium
\[AB\parallel CD\]
A trapezium, is an isosceles trapezium if its non - parallel sides are equal.
ABCD is a isosceles trapezium if
\[AB\parallel CD\text{ }and\text{ }AD=BC\].
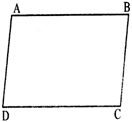
Parallelogram:- A quadrilateral having both pairs of opposite sides are equal is called a. parallelogram,
In parallelogram ABCD \[AB\parallel CD\] and \[AD=BC\],
In a parallelogram two opposite sides are equal.
i.e., \[AD=BC,AB=CD\]
In a. parallelogram two opposite angles are equal
i.e., \[\angle A=\angle C\] and \[\angle B=\angle D\].
In a parallelogram sum of two adjacent angles is \[{{180}^{{}^\circ }}\]e., \[\angle A+\angle B={{180}^{{}^\circ }},\angle B+\angle C={{180}^{{}^\circ }}\]
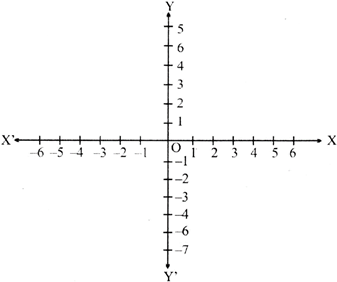
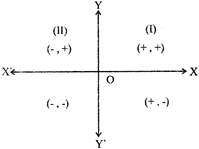
Co-ordinate Geometry-The branch of mathematics in which Geometric problems are solved through algebra by using the co-ordinates system is known as co-ordinate Geometry.
The horizontal line XOX' is called x-axis and the vertical line YOY' is called the y-axis.
The point O is called the origin and co-ordinates of-the origin are (0, 0)
he distance of a point from y-axis is called a x-coordinate or abscissa
The distance of the point from x axis is called its y-coordinate or ordinate.
The y co-ordinate of every point on x axis is zero. So, the co-ordinates of any point on the x axis are of the form (x, 0)
The x co-ordinate of every point on y axis is zero. So, the co-ordinates of any point on y- axis are of the form (0,y)
\[x=0\], denotes y axis
\[y=0\], denotes x axis
\[y=a\], where a is constant denotes a straight line Parallel to x axis
\[x=a\], where a is constant denotes a straight line parallel to y axis
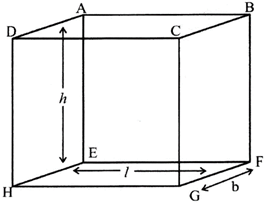
Cuboid:- A cuboid is a solid bounded by the rectangular plane regions. A cuboid has six faces, 12 edges and 8 vertices.
Total surface Area of the cuboid \[=2\left( lb+bh+hl \right)\] sq. units.
Volume of the cuboid = \[l\times b\times h\]
Diagonal of the cuboid \[=\sqrt{{{l}^{2}}+{{b}^{2}}+{{h}^{2}}}\]
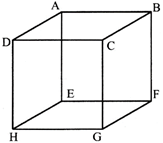
A cuboidal whose length, breadth and height are equal is called a cube.
If length of each edge of a cube is a,
Then, volume of the cube \[={{a}^{3}}\]
Total surface area of the cube\[=6{{a}^{2}}\]
Diagonal of the cube \[=\sqrt{3a}.\]
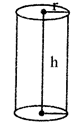
Cylinder:- It is formed by rotating one side of a rectangle about its opposite side.
Volume of the cylinder \[=\pi {{r}^{2}}h\]
Area of the base\[=\pi {{r}^{2}}\]
Area of the curved surface =\[2\pi rh\]
Total surface Area \[=2\pi rh+2\pi {{r}^{2}}h=2\pi r\left( h+r \right)\]
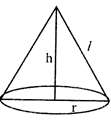
Right Circular Cone:- A right circular cone is a solid generated by a right angled triangle around its height.
Radius = r. Height = h
Slant height = 1
Volume of the cone \[=\frac{1}{3}\pi {{r}^{2}}h\]
Area of the Base\[~=\pi {{r}^{2}}\]
Area of the curved surface \[=\pi r\sqrt{{{h}^{2}}+{{r}^{2}}}=\pi rl\]
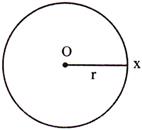
Sphere:- The set of all points in the space which are equidistant from fixed j3omt is called a sphere.
OX = Radius = r
Volume of a sphere \[=\frac{4}{3}\pi {{r}^{3}}\]
Surface Area of a sphere \[=4\pi {{r}^{2}}\]
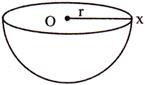
Hemisphere:- A plane through the centre of the sphere divides the sphere into two equal parts each of which is called a hemisphere.
Radius = OX = r
Volume of a Hemisphere \[\frac{2}{3}\pi {{r}^{3}}\]
Curved surface area of a Hemisphere = \[2\pi {{r}^{2}}\]
Total surface area of a Hemisphere = \[3\pi {{r}^{2}}\]
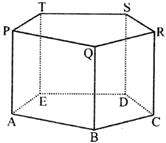
Prism:- Volume of Right prism \[=Area\text{ }of\text{ }Base\times Height.\]
Lateral surface area of a prism \[=perimeter\,of\,base\times Height\]
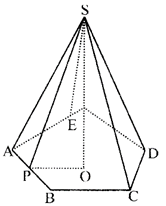
Pyramid:- Surface area of pyramid \[=\frac{1}{2}\left( perimeter\text{ }of\text{ }base \right)\times Slant\text{ }Height\]
Whole surface = The slant surface + the area of the base
Volume of pyramid \[=\frac{1}{2}\left( perimeter\text{ }of\text{ }base \right)\times Slant\text{ }Height\]
When the chance of occurring an event expressed quantitatively it is known as probability. In other words, probability is a concept of measuring the degree of uncertainty.
Experiment:- An operation which can produce some well-defined results is known as an experiment.
Random Experiment:- An operation in which an possible results are known but the exact result cannot be predicted in advance in known as random experiment.
Example:- Throwing of an unbiased die.
Tossing of a fair coin.
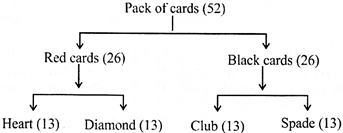
Drawing a card from a well - shuffled pack of cards.
When an unbiased coin is tossed, then either a Head (H) or a (T) appears.
A dice is well balanced cube with its six faces marked with numbers 1, 2, 3, 4, 5, 6 respectively. Hence when we throw a die, the outcome is the number that appears on its upper face.
Sample Space:- The set of all possible results in a random experiment is called a sample space and it is generally denoted by S.
Example:- In tossing a coin
S = {H, T}
In tossing two coins, S = {HH, TT, HT, TH}
In throwing a die, S = {1, 2, 3, 4, 5, 6}
Event:- Any subset of a sample space is called an event.
Example:- In a single throw of a die, the event of getting an prime number is given by E = {2, 3, 5}
Obviously, here sample Space (S) = {1, 2, 3, 4, 5, 6}
Here i.e., E is a subset of S.
Probability of occurrence of an event
RESULTS ON PROBABILITY
Probability of a same event is 1.
Probability of an impossible event = 0. i.e., P(E) = 0
Sum of the possibilities of an outcome of an experiment is 1. i.e., P (S) = 1
So the possibility of any events lies between 0 and 1. i.e.,
There are 4 honours of each suit viz. Aces, Kings, Queens and Jacks.
There are three face cards of each suit, king, Queen and Jack.
Statistics is a branch of mathematics which is useful in data collection, data classification and data interpretation.
DATA
It is a information in the form of a numerical figures.
FREQUENCY
The number of times a particular observation occurs in the data is called its frequency.
RANGE
The difference of the largest and smallest values of the given data is called its range.
LOWER LIMIT AND UPPER LIMIT
In the classes 10 - 20, 20 - 30, 30 - 40, the value 10, 20 and 30 are called the lower limit of the classes and the values 20, 30 and 40 are called the upper limits of the classes.
CLASS MARK
Class-mark of a class a-b is equal to\[\frac{a+b}{2}\].
CUMULATIVE FREQUENCY
The frequency of the first class is added to that of the second and this sum is added to that of the third and so on. Then the frequencies so obtained are known as commulative frequency
GEOGRAPHICAL REPRESENTATION OF DATA
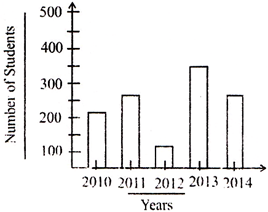
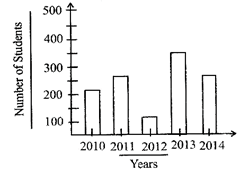
Bar Graph: Bar graph is a pictorial representation of a data in which usually bars of uniform width are drawn with equal spacing between them on one axis (x - axis) depicting the variables. The value of the variable are shown on the other axis (v - axis) and the height of the bars depend on the value of the variable,
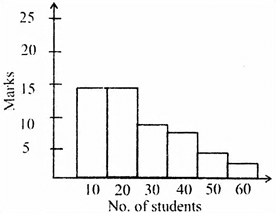
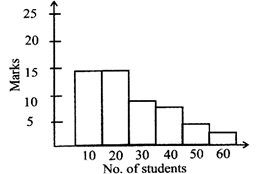
Histogram: This is a form of representation like the bar graph, but it is used for continuous class interval. It consist of a set of continuous bars drawn adjacent to each other.
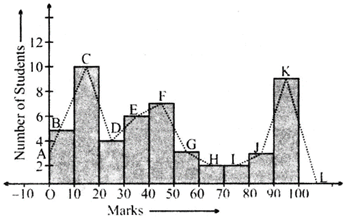
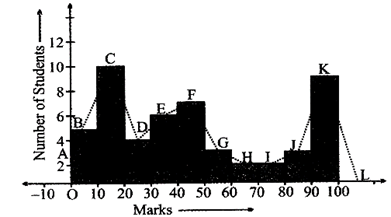
Frequency Polygon: Frequency polygon are used to represent classified or grouped data graphically. It is a polygon whose vertices are the mid-points of the top sides of the rectangles, forming the histogram of the frequency distribution
CENTRAL TENDENCY
Mean: The mean of a number of observation is the sum of values of the all the observations divided by the total number of observations. It is denoted by\[\overline{X}\].
\[\text{There are the mean}\,\overline{\text{X}}\,\text{=}\,\,\frac{\text{Sum of all observations}}{\text{Total No}\text{. of observations}}\]
If \[{{x}_{1}},{{x}_{2}},{{x}_{3}}........{{x}_{n}}\], are the observations and their respective frequencies are \[{{f}_{1}},{{f}_{2}},{{f}_{3}}......{{f}_{n}}\]then
\[\overline{X}=\frac{{{f}_{1}}{{x}_{1}}+{{f}_{2}}{{x}_{2}}+{{f}_{3}}{{x}_{3}}+......{{f}_{n}}{{x}_{n}}}{{{f}_{1}}+{{f}_{2}}+{{f}_{3}}+......+{{f}_{n}}}\]
Median:- The median is that value of the given number of observation, which divided u1 into exactly two points. So, when the data is arranged in ascending or descending order the median of ungrouped data in calculated as follows-
(I) When the number of observations is odd than the median is the value of the \[{{\left( \frac{n+1}{2} \right)}^{th}}\]observation,
(II) When the no. of observation is even, than the average of media is \[{{\left( \frac{n}{2} \right)}^{th}}\] and \[{{\left( \frac{n}{2}+1 \right)}^{th}}\] observations.
Logarithm:- Let a be a positive real number other than 1 and \[{{a}^{x}}=m(where\,m>0)\]then x is called the logarithm, of m to the base a and written, as \[lo{{g}_{a}}\]m.
Example:- \[\left( I \right){{10}^{4}}=10000\]
\[\Rightarrow lo{{g}_{10}}=10000=4\]
(II) \[If{{3}^{-3}}=\frac{1}{27}\Rightarrow {{\log }_{3}}\frac{1}{27}=-3\]
LAWS OF LOGARITHMS
Statistics is a branch of mathematics which is useful in data collection, data classification and data interpretation.
Data
It is a information in the form of a numerical figures.
Frequency
The number of times a particular observation occurs in the data is called its frequency.
Range
The difference of the largest and smallest values of the given data is called its range.
Lower limit and upper limit
In the classes 10 - 20, 20 - 30, 30 " 40, the value 10, 20 and 30 are called the lower limit of the classes and the values 20, 30 and 40 are called the upper limits of the classes.
Class Mark
Class-mark of a class a-b is equal to \[\frac{a+b}{2}\]
Cumulative frequency
The frequency of the first class is added to that of the second and this sum is added to that of the third and so on. Then the frequencies so obtained are known as commutative frequency
Geographical Representation of data
Bar Graph: Bar graph is a pictorial representation of a data in which usually bars of uniform width are drawn with equal spacing between them on one axis (x - axis) depicting the variables. The value of the variable are shown on the other axis (y axis) and the height of the bars depend on the value of the variable.
Histogram: This is a form of representation like the bar graph, but it is used for continuous class interval. It consist of a set of continuous bars drawn adjacent to each other.
Frequency Polygon: Frequency polygon are used to represent classified or grouped data graphically. It is a polygon whose vertices are the mid-points of the top sides of the rectangles, forming the histogram of the frequency distribution
Central Tendency
Mean: The mean of a number of observation is the sum of values of the all the observations divided by the total number of observations. It is denoted by \[\overline{X}\].
Therefore the mean \[\overline{X}=\frac{\text{Sum of all observations}}{\text{Total No}\text{. of observations}}\]
If \[{{x}_{1}},{{x}_{2}},{{x}_{3}},.......{{x}_{n}}\]are the observations and their respective frequencies are \[{{f}_{1}},{{f}_{2}},{{f}_{3}},........{{f}_{n}},\]then
\[\overline{X}=\frac{{{f}_{1}}{{x}_{1}}+{{f}_{2}}{{x}_{2}}+{{f}_{2}}{{x}_{3}}+....{{f}_{n}}{{x}_{n}}}{{{f}_{1}}+{{f}_{2}}+{{f}_{3}}+......+{{f}_{n}}}\]
Median: The median is that value of the given number of observation, which divided it into exactly two points. So, when the data is arranged in ascending or descending order the median of ungrouped data in calculated as follows -
(I) When the number of observations is odd the median is the value of the \[{{\left( \frac{n+1}{2} \right)}^{th}}\]observation.
(II) When the more...
 A quadrilateral which sides are equal and each angle is equal to \[{{90}^{{}^\circ }}\] is called square.
Diagonals of square are equal and cut each other at\[{{90}^{{}^\circ }}\].
i.e., \[AB=BC=CD=DA\].
\[\angle A=\angle B=\angle C=\angle D\]
and \[AC=CD\].
A quadrilateral which sides are equal and each angle is equal to \[{{90}^{{}^\circ }}\] is called square.
Diagonals of square are equal and cut each other at\[{{90}^{{}^\circ }}\].
i.e., \[AB=BC=CD=DA\].
\[\angle A=\angle B=\angle C=\angle D\]
and \[AC=CD\].
 A quadrilateral whose all angles arc right angle and. each pair of opposite sides are equal is called Rectangle.
i.e., \[\angle A=\angle \mathbf{B}=\angle C=\angle D={{90}^{{}^\circ }}\], and \[AB=CD,AD=BC\] The diagonals of rectangle are equal and bisect each other at right angle. Each diagonal divides rectangle into congruent triangles.
i.e., \[AC=BD\] and \[\Delta ADC=\Delta ABC\], \[\Delta ABD=\Delta BCD\]
A quadrilateral whose all angles arc right angle and. each pair of opposite sides are equal is called Rectangle.
i.e., \[\angle A=\angle \mathbf{B}=\angle C=\angle D={{90}^{{}^\circ }}\], and \[AB=CD,AD=BC\] The diagonals of rectangle are equal and bisect each other at right angle. Each diagonal divides rectangle into congruent triangles.
i.e., \[AC=BD\] and \[\Delta ADC=\Delta ABC\], \[\Delta ABD=\Delta BCD\]
 \[AB\parallel CD\]
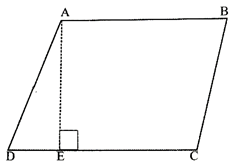 Area of parallelogram \[=\frac{1}{2}\times CD\times AE\]
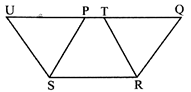 i.e., Area of parallelogram PQRS = Area of Parallelogram SRTU.
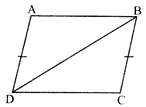 Area of \[\Delta ABD\] = Area of \[\Delta BCD\]
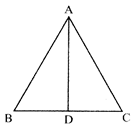 Area of \[\Delta ABC=\frac{1}{2}(BC\times AD)\]
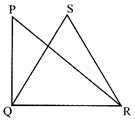 i.e., Area of \[\Delta PQR\] = Area of \[\Delta QRS\]
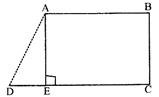 Area of trapezium \[ABCD=\frac{1}{2}(AB+CD)\times AE\]
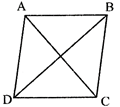 Area of Rhombus \[=\frac{1}{2}AC\times BD\]
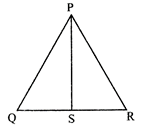 Area of \[\Delta PQS=\Delta PRS\].
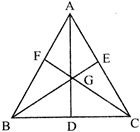 Area of \[\Delta AGB\]= Area of \[\Delta BGC\]
= Area of\[\Delta AGC\].
Area of \[\Delta AGB\]= Area of \[\Delta BGC\]
= Area of\[\Delta AGC\].
 Volume of the cuboid = \[l\times b\times h\]
Diagonal of the cuboid \[=\sqrt{{{l}^{2}}+{{b}^{2}}+{{h}^{2}}}\]
Volume of the cuboid = \[l\times b\times h\]
Diagonal of the cuboid \[=\sqrt{{{l}^{2}}+{{b}^{2}}+{{h}^{2}}}\]
 If length of each edge of a cube is a,
Then, volume of the cube \[={{a}^{3}}\]
Total surface area of the cube\[=6{{a}^{2}}\]
Diagonal of the cube \[=\sqrt{3a}.\]
If length of each edge of a cube is a,
Then, volume of the cube \[={{a}^{3}}\]
Total surface area of the cube\[=6{{a}^{2}}\]
Diagonal of the cube \[=\sqrt{3a}.\]
 Volume of the cylinder \[=\pi {{r}^{2}}h\]
Area of the base\[=\pi {{r}^{2}}\]
Area of the curved surface =\[2\pi rh\]
Total surface Area \[=2\pi rh+2\pi {{r}^{2}}h=2\pi r\left( h+r \right)\]
Volume of the cylinder \[=\pi {{r}^{2}}h\]
Area of the base\[=\pi {{r}^{2}}\]
Area of the curved surface =\[2\pi rh\]
Total surface Area \[=2\pi rh+2\pi {{r}^{2}}h=2\pi r\left( h+r \right)\]
 Radius = r. Height = h
Slant height = 1
Volume of the cone \[=\frac{1}{3}\pi {{r}^{2}}h\]
Area of the Base\[~=\pi {{r}^{2}}\]
Area of the curved surface \[=\pi r\sqrt{{{h}^{2}}+{{r}^{2}}}=\pi rl\]
Radius = r. Height = h
Slant height = 1
Volume of the cone \[=\frac{1}{3}\pi {{r}^{2}}h\]
Area of the Base\[~=\pi {{r}^{2}}\]
Area of the curved surface \[=\pi r\sqrt{{{h}^{2}}+{{r}^{2}}}=\pi rl\]
 OX = Radius = r
Volume of a sphere \[=\frac{4}{3}\pi {{r}^{3}}\]
Surface Area of a sphere \[=4\pi {{r}^{2}}\]
OX = Radius = r
Volume of a sphere \[=\frac{4}{3}\pi {{r}^{3}}\]
Surface Area of a sphere \[=4\pi {{r}^{2}}\]
 Radius = OX = r
Volume of a Hemisphere \[\frac{2}{3}\pi {{r}^{3}}\]
Curved surface area of a Hemisphere = \[2\pi {{r}^{2}}\]
Total surface area of a Hemisphere = \[3\pi {{r}^{2}}\]
Radius = OX = r
Volume of a Hemisphere \[\frac{2}{3}\pi {{r}^{3}}\]
Curved surface area of a Hemisphere = \[2\pi {{r}^{2}}\]
Total surface area of a Hemisphere = \[3\pi {{r}^{2}}\]
 There are 4 honours of each suit viz. Aces, Kings, Queens and Jacks.
 CENTRAL TENDENCY
 Central Tendency


